|
Thanks to the efforts of Enviro-Ed, Bainbridge Island Land Trust,
teachers, city planners, and other volunteers, NatureMapping began in
1993 and has continued to this day. Saki Middle School is the only
school that has continued to participate; almost all the schools have
provided data to NatureMapping. Data were collected for 1994,
1996-2005.
An estimated 2,190 students have provided the bulk of the 11,077
observations, collecting data from their homes, around the schools and
focused field trips to monitor sites identified many years ago. Other
data providers included private landowners, as well as, a
Seattle Audubon field trip, and an ornithologist visiting the island.

Number of Species Reported
A total of 158 species were reported, averaging 104 species reported
each year. A list of questionable species has been submitted to experts
on the island to help finalize the total number of species.
Species List

Download the Bainbridge Island Species List (pdf)
Of the 158 species, on the list, 35 species are considered "at-risk",
listed or is a candidate for state endangered, threatened, etc, or are a
Priority of Habitats and Species (PHS) species. The fact that some of
these 35 species have continued to be reported for the past 11 years
shows the habitat continues to support them - something for Bainbridge
Island to be proud of.
Lists of species reported 5 years or longer, and less than 5 years are included to show the most common species, and others that need more information and verification. These lists will be finalized after the "questionable" species list is reviewed.
Species Reported > 5 years and Species Reported < 5 years (pdf)
What the data tell us
First it is important that the 5th grade teachers continue to collect
data as a team effort. Each of the following maps shows student
coverage by quarter-section by a team of teachers for the year 2005.
The last map shows all the 5th graders locations together...almost
covering the Island completely.
|

Saki Middle School Team 1
|

Saki Middle School Team 2
|
|

Saki Middle School Team 3
|

Saki Middle School Team 4
|
|

Saki Middle School Team 5
|

Saki Middle School Team 6
|

Saki Middle School -- All Teams Combined
Unfortunately, 2,514 records did not have quarter-sections reported. This means analyses can be conducted on sightings by quarter-sections, but for only 8,563 of the records. A map of the Island using the Sections show where the most number of species were recorded for all 11,077 records.

The quarter-section map further refines where the most species were observed for the past 11 years.
Bald eagle sightings on Bainbridge Island
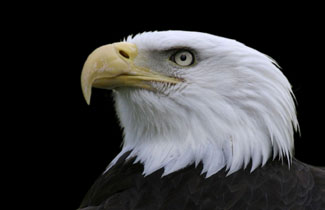

Maps can be developed for each species. The first Bald eagle map shows
where all sightings occurred...basically everywhere on the Island.
However, the second map shows where the most sightings occurred, more on
the east side of the Island.
What next?
Technology now makes it easier to report observations with more precise
accuracy. Although geographic location is important, matching the
sighting of fish and wildlife to a type of habitat allows communities to
learn the types of habitats that support local fish and wildlife so that
they may make better land use decisions with these data.
Bainbridge Island Land Trust continues to assist the local schools to
conduct NatureMapping. The Bainbridge Island High School biology
teachers are ready to prepare their students to collect biodiversity
data to complement the work Saki students are doing, and The
NatureMapping Program will be there to assist in their efforts.
|
