Water Module
Data Collection Menu
Water Module »
|
Data Collection Methods
Monitoring Stream Flow
Level 1/2
Level 3/4
Equipment needed
- pencils
- clipboard
- "flow" data sheet
- tape measure (50 feet)
- markers (string, stakes)
- visible float (orange, stick, rubber ducky or whatever works. Oranges work well because they float partially submerged in the water, they are fairly water-proof, less subject to wind resistance and you can eat them when you are done.)
- stopwatch
- calculator
- waterproof boots/waders
- Flow is the volume of water that passes a point in the stream in a unit of time.
- flow = volume/time
- Volume is a product of length and cross sectional area,
- flow = (length x cross sectional area)/time
- Velocity is a measure of length (or distance)/time
- flow = velocity x cross sectional area
To calculate flow, you will need to measure the velocity of the water and the cross sectional area of the stream's channel.
While the float method (floating an orange down the stream) serves more as an estimation of flow, it is a tried and true method.
In addition to measuring flow, you should keep track of the amount of precipitation that falls and the time that elapsed between the last storm and your flow measurement.
Where?
You will need a section of your stream reach that is as straight and uniform in width as possible (channelized sections of streams work well for this exercise). The section you choose should also be shallow enough for your to wade across safely. Make sure that you come back to the same place every time you measure flow.
When?
Because flow is so variable, we recommend that you measure it at least once per month.
How?
Velocity
You will need at least two people, and best three, for this exercise.
- Measure the length (distance) of the stream section you have chosen for your flow measurement and record it on the Data Sheet. Mark the start and finish lines in some manner. (A tape measure of string held across the stream works well).
- Person #1 wades in the stream at the upstream starting line, float in hand. Person #2 wades in the stream at the downstream finish line. Person #3, if available, stands on the bank next to the finish line, stopwatch and clipboard in hand. If you have only 2 people, the one at the finish line holds the stopwatch.
- Person #1 drops the float on the surface, upstream from the starting line. As the float passes the starting line, person #1 yells "go" and person #2 starts the stopwatch.
- When the float crosses the finish line, person #2 stops the stopwatch, catches the float, and records the time, or gets person #3 to help out.
- Discard any trials in which the float gets caught in debris, rocks or eddies.
- On the Data Sheet, record the time in seconds that it took for the float to travel the measured distance.
- Because the velocity of the water varies across the width of the stream, you need to repeat this process several times, sending the float down different flow paths. We recommend ten float trials to get a velocity measurement representative of your stream.
- Record all the time values. Calculate the average float time by dividing the sum of the time values by the number of float trials.
- To calculate the average velocity, divide the distance value by the average float time value. You result is the average surface velocity.
- Because the velocity of a stream varies from the surface to the bottom, adjust your result to reflect the overall average velocity of the stream. (Thomas Dunne and Luna Leopold, internationally recognized hydrologists and authors of Water in Environmental Planning, use a correction factor of 0.8 when calculating flows with the float method.) The adjusted value is called the corrected average velocity.
Cross Sectional Area
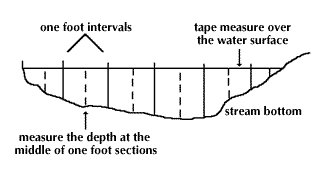
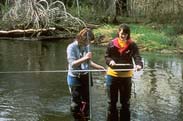
- Stretch a tape measure across the stream at the starting point of your velocity float trials. The tape measure should be perpendicular to stream flow and just above the surface of the water. The first person holds the "0" point on the tape measure even with one wetted edge. A second person on the opposite bank holds the tape measure level, taut, and even with the other wetted edge. A third person stands on the bank with the Data Sheet and records information.
- A fourth person, stadia rod in hand, starts six inches from the wetted edge and moves along the tape measure at one foot intervals. The stadia rod is used to measure the depth of the water (the vertical distance from the water surface to the stream bottom) at the mid-point of each one foot interval. (Thus, the first and last measurements are made 6 inches from the wetted edges.) The in-stream person calls out these measurements to the person on the bank, who records them.
- If measured at one-foot intervals, each depth is roughly equivalent to the area of a one-foot-wide section of the wetted stream. Thus the sum of these areas (or depths) is the total cross-sectional areas of the wetted stream at the point measured.
- Sum the depths and record the result for Cross Section 1.
- Your result is the cross sectional area of the wetted stream at the starting line of your velocity float trials. In order to find the average cross sectional area of the whole length of the channel used for the float trials, you'll need to repeat steps 1-4 at two more points. Use the finish line and a point in the middle of the section.
- Take the three cross sectional area values and average them to find average cross sectional area. Record the result.
Calculating Flow
Now it is possible to calculate the flow with the information you have gathered. Multiply the corrected average velocity by the average cross sectional area and record your flow value on the Data Sheet.
A note on units: Most studies in the U.S. measure flow in cubic feet per second (CFS). If you want to compare your measurements easily with other studies, measure your depths in feet (cross sectional area in square feet) and your velocity in feet per second. This will give you flow in cubic feet per second.
Now What?
For a quality control
check, ask a hydrologist to come out in the field with you and take velocity measurements with a flow meter, to see how your float method compares.
DID YOU KNOW?
Adult fish swim at different speeds; cruising, sustained and burst. For example, Chinook salmon can cruise from 0 - 8.6 ft/sec and burst up to 21.8 ft/sec. On the other hand, Whitefish can cruise from 0 - 1.3 ft/sec and burst up to 8.6 ft/sec.
|
|